Entwicklungsumgebung
All necessary tools required for the exercises (and thus for the development of StuBS) are installed in the CIP. You are able to remotely connect to the CIP hosts via SSH or a web-based graphical client
Of course you can also work on the assignments at home, we therefore recommend using an up-to-date Linux. Below are some hints on how to configure your Linux system accordingly.
In addition, the script setup-env.sh will help you checking the requirements and setting up a passwordless SSH connection for working at home.
In case you don't have access to such a Linux environment, you can use a virtual machine for StuBS development: We provide a pre-configured image (1.3 GB) for VirtualBox (Password: stubs).
- Attention
- If you want to install the software at home, you are (of course) fully responsible for all problems. Issues on your private system are no excuse for late submissions of the assignment.
- Note
- Since errors can sometimes sneak in during operating system development, you have to extensively test your solution before you hand it in. You can use an emulator (Qemu) and the dedicated StuBS test hardware (our reference platform) located in the WinCIP. The presentation of your solution is done on the test hardware, a solution only running in an emulator is not sufficient!
Requirements
To build StuBS, the C++ source files are compiled using g++ from a current GCC (version > 7) as specified in the Makefile, however The LLVM C++ compiler clang++ can be used as well. Startup code and hardware-related subprograms written in assembly are translated using the Netwide Assembler (nasm). The x86 emulator Qemu is suitable for preliminary testing and, thanks to a built-in debug stub, also for debugging with the GNU Debugger (gdb).
The folder /proj/i4stubs/ in the CIP pool houses additional required files (e.g. for GRUB when building an ISO) and the TFTP directory allowing you to network boot your kernel
Skeleton / Source Code Management
- We provide a skeleton for StuBS, with the basic boot code. This is available via git repository in our Gitlab.
git clone https://gitlab.cs.fau.de/i4-exercise/bs/ws22/oostubs-gruppe-xx.git oostubs
- For the remaining exercises we will update your master branch for each task successively - these changes usually contain new files for the exercise.
- A short overview of the git commands can be found here. For a deeper introduction to distributed source code management we recommend the Pro Git book, available under the Creative Commons license.
Building StuBS
- The files you receive from us should usually compile without an error, but contain incomplete code and are therefore missing the required functionality. You have to complete code in the functions and classes according to the documentation on this website.
- You can start the actual building of StuBS by calling
makein the projects root directory. All.ccand.asmfiles in this directory are then compiled with the appropriate tools (compiler or assembler) and linked together to a bootable system image. The commandsmake {kvm,qemu,netboot}{,-gdb}{-dbg,-opt,-noopt,-verbose}are available for testing and debugging. - The Makefile target
helpwill give you a detailed overview about its capabilities.uj66ojab@cip6a0:~/oostubs> make help MAKEFILE for the teaching operating system OOStuBS -------------------------------------------------- Executing 'make' will compile the operating system from source. All targets exist in different flavours in addition to <name>: <name>-noopt, <name>-opt, <name>-dbg, and <name>-verbose. Targets suffixed with -noopt are compiled without optimizations, -opt targets produce a highly optimized binary, while -dbg targets only use optimizations not hindering debugging. Targets suffixed with -verbose generate binaries including verbose output (via DBG_VERBOSE), making such targets useful for debugging. To get a verbose make output, clear VERBOSE, e.g. make VERBOSE=. The following targets are available (each target can be suffixed by -noopt and -verbose): all Builds OOStuBS, generating an ELF binary qemu Starts OOStuBS in QEMU Due to the internal design of QEMU, some things (especially race conditions) might behave different compared to hardware! qemu-gdb Starts OOStuBS in QEMU with internal GDB stub and attaches it to a GDB session allowing step-by-step debugging kvm Starts OOStuBS in KVM, a hardware-accelerated virtual machine kvm-gdb Same as qemu-gdb, but with hardware acceleration iso Generates a bootable system image (File: .build/stubs.iso) qemu-iso Starts the system in QEMU by booting from the virtual CD drive kvm-iso Same as qemu-iso, but with hardware acceleration usb Generates a bootable USB mass-storage device; the environment variable USBDEV should point to the USB device cd Generates a bootable CD; the environment variable should point to the CD writer lint Checks the coding style using CPPLINT tidy Uses Clang Tidy for a static code analysis netboot Copies OOStuBS to the network share, allowing the test systems to boot your system Apart from the above targets that run your implementation, our solution can be run in KVM (at least when called in the CIP) using the target solution-exercise where exercise is the number of the exercise whose solution should be executed.
Testing StuBS
- The fastest and easiest way to test your implementation is to run your system image in Qemu with hardware virtualization:
uj66ojab@cip6a0:~/oostubs> make kvm
The QEMU target will by default emulate a system with four cores. For the development of OOStuBS, this does not bother you, because the additional cores are simply ignored. For MPStuBS, only the acceleration provided with the KVM extension will makes your system run really parallel on multiple cores. Hence, this is quite close to the test on real hardware in terms of race conditions and faulty synchronization. - To simplify troubleshooting, hardware virtualization can also be disabled by using the
make qemucommand instead. In this mode the guest system is only emulated pseudo-parallel, which makes it easier to find more serious bugs, but on the other hand it might mask existing ones that otherwise only occur withmake kvmor on real hardware. To test your operating system on the reference hardware in the CIP pool, just use the Makefile target
netboot:uj66ojab@cip6a0:~/oostubs> make netboot
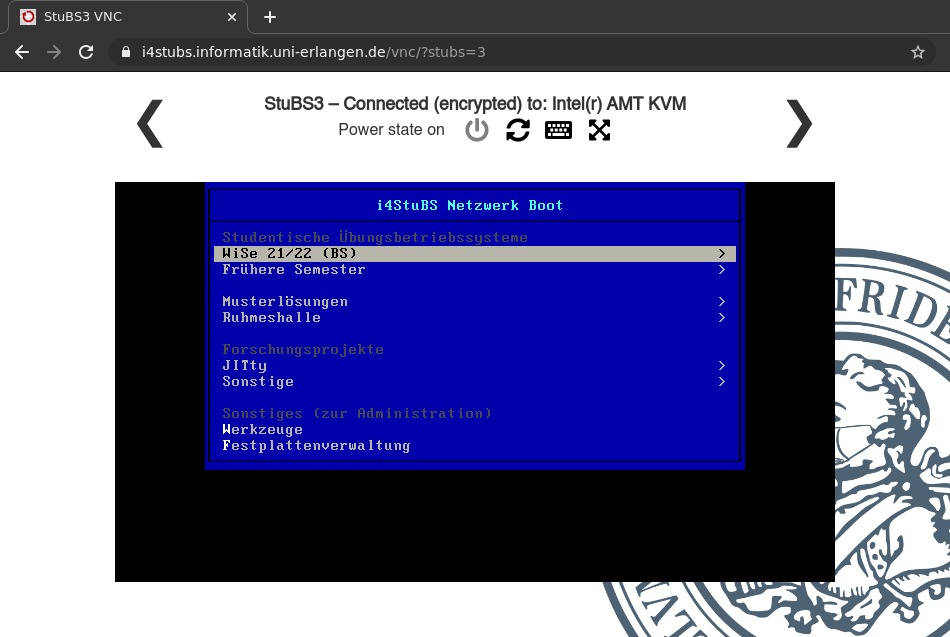
This will compile your StuBS and copy the system image to the TFTP server so that the test hardware can access it with the help of the network boot loader PXELinux. The test hardware automatically boot from the network when they are switched on. In the boot menu that appears, you only have to select the current semester and then the entry with your login name to boot your kernel.
- Note
- During the exercises, please don't allocate the hardware for too long. After you've finished testing, please reboot the system.
- If you are not in the CIP right now, you can still access the hardware via the web interface with the user and password from the lecture. You can start the hardware using the management overview:
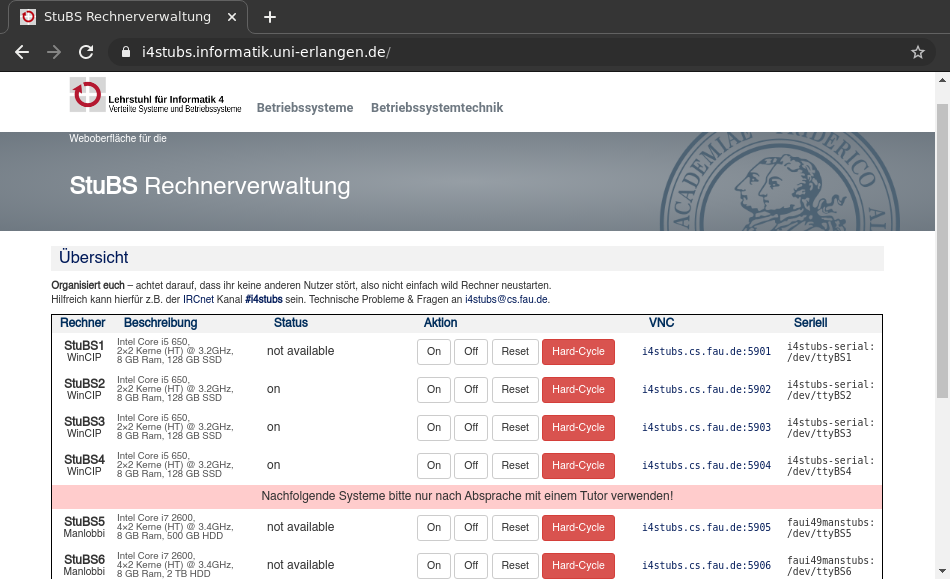
Alternatively, you can use the /proj/i4stubs/tools/stubs tool (via SSH) to control the test machines. In case the system will not react on the default actions (On, Off or Reset), try a Hard-Cycle and wait for at least 20 seconds.
- Attention
- Try to coordinate access to the test computers with your fellow students using the IRCnet channel
#i4stubsso that no one is interrupted while testing.
You can use VNC to view the contents of the screen and interact with your operating system using keyboard and mouse. If you have no VNC client (like Remmina) at hand, you can also use the web client – just click on the VNC address on the management page:
- Note
- In the CIP a red rectangle is visible on the screen if a VNC connection is currently established with the corresponding hardware.
If you have setup a passwordless SSH login (using a key) on the CIP computers, you can even use the Makefile target netboot from your private PC after adjusting the variable NETBOOTSSH in the tools/remote.mk.
- The default behavior of the default build system is to use optimization level
-O3, however the resulting machine code can make debugging much more difficult on persistent bugs. For these cases, all the Makefile targets above are also available with the suffix-dbg(use-Og, which enables only optimizations not interfering with debugging) and-noopt(which completely disables the compiler optimizations with-O0):uj66ojab@cip6a0:~/oostubs> make qemu-gdb-dbg
- And – if nothing works – always remember: Don't Panic. Grep some coffee, take a break and then read your code again. Every bit can be crucial. Don't worry, debugging is an essential part in operating system development (like swearing).
Debugging StuBS
If you get stuck with simple printf debugging, you can use the debug stub integrated in Qemu and connect a debugger (e.g., gdb) to the emulation. This allows you to easily run your operating system code step by step, easing the detection of the reason for crashes or unwanted behavior. For this purpose the Makefile provides the targets qemu-gdb and kvm-gdb (which can be appended with -dbg for a debug build):
uj66ojab@cip6a0:~/oostubs> make qemu-gdb
In this configuration, the Qemu debug stub waits in the emulator for a socket connection through which a gdb debugger can connect. The debugger will automatically be started so that the gdb prompt appears in the terminal immediately after Qemu is started.
- A brief reference of the GDB functions can be found here.
- If you want detailed instructions on how to use a specific GDB command, you can use the built-in help function in GDB:
(gdb) help <command>
A full overview of gdb is given in Debugging with GDB.
- Attention
- Since Qemu pauses the operating system when using the debug stub, the program execution in
gdbmust not be restarted withrun, but must be continued withcontinueinstead.
Remote control GDB from an Editor or IDE
With the command make qemu-wait qemu can be started in a halted state. qemu won't start the simulation before it receives an continue command from a connected monitor.
This can be used to attach either gdb or another debugger (possibly integrated into the editor or IDE) manually. Otherwise make dbg can be used to attach to the running qemu. In addition to make qemu-wait the KVM variant can be executed using make kvm-wait.
Debugging via SSH
If the DISPLAY environment variable of the current session is not set (as is the case for most SSH sessions), qemu will be executed with a ncurses interface for its VGA output. However this will occupy the whole (pseudo) terminal. Thus it is advisable to use a terminal mutliplexer (such as screen or tmux) to have the option to have access to another shell. The shell may either be used to remote control qemu by attaching a gdb, or to kill a rouge kernel if no monitor is attached (pkill qemu).
Then the commands make qemu-wait and make dbg can be issued from two separate PTS to have both visual output of the kernel, and an active debugger.
StuBS specific GDB extensions
There are stubs-specific gdb extensions at tools/gdb/ which are loaded whenever the debugger is invoked via the provided Makefile. The scripts communicate with qemu via the monitor interface, exposed by GDBs python API. Currently the following commands are available:
gdtview:
gdtview <base> <limit>If no arguments are provided, the function displays the current global descriptor table stored at the current core. Optional parameters define the base of the GDT (linear address) and its 16-bit limit.
idtview:
idtview [<base> <limit>]If no arguments are provided, the function displays the current interrupt descriptor table stored at the current core. Otherwise it is possible to select the IDTs base and length manually.
vaview:
vaview [<cr3>] <virtual address>The command expects at least one virtual address, for which the table walk will be performed based on the current cores
cr3register value. It displays the different indices into the page tables, the address of the page tables and their content. The resolved mapping is displayed as well. Optionally it is possible to use any other value as PML4 base by setting the address as first parameter, followed by the virtual address.$current(): list the currently running
struct Thread *Fetches the currently running thread from the Dispatcher. This only works if the students use the same Dispatcher structure, that is used in this repository.
These $current() function can be combined with other commands. For example vaview $current()->mapping $rsp could be used to check if the stack pointer of the current thread points to valid memory with the correct access permissions (if Thread::mapping would be a cr3 value).